
Home Prices in 2026 vs. 1976: What Affordability Shows
Owning a home has long been considered a key part of the "American Dream." But how much harder is it for a typical household to buy a home today than it was in 1976, when we celebrated the country's Bicentennial? Home prices have risen far faster than general inflation, while wages, mortgage rates, living costs, and down-payment demands have all changed the math.
A house bought in 1976 wasn't automatically cheap in every city, and 2026 buyers aren't facing one uniform market. Still, national figures show a clear pattern: the price-to-income burden is larger today.
The most useful comparison separates sticker price from monthly payment, then accounts for the money a household needs for everything else.
Home Prices in 1976 Compared With 2026
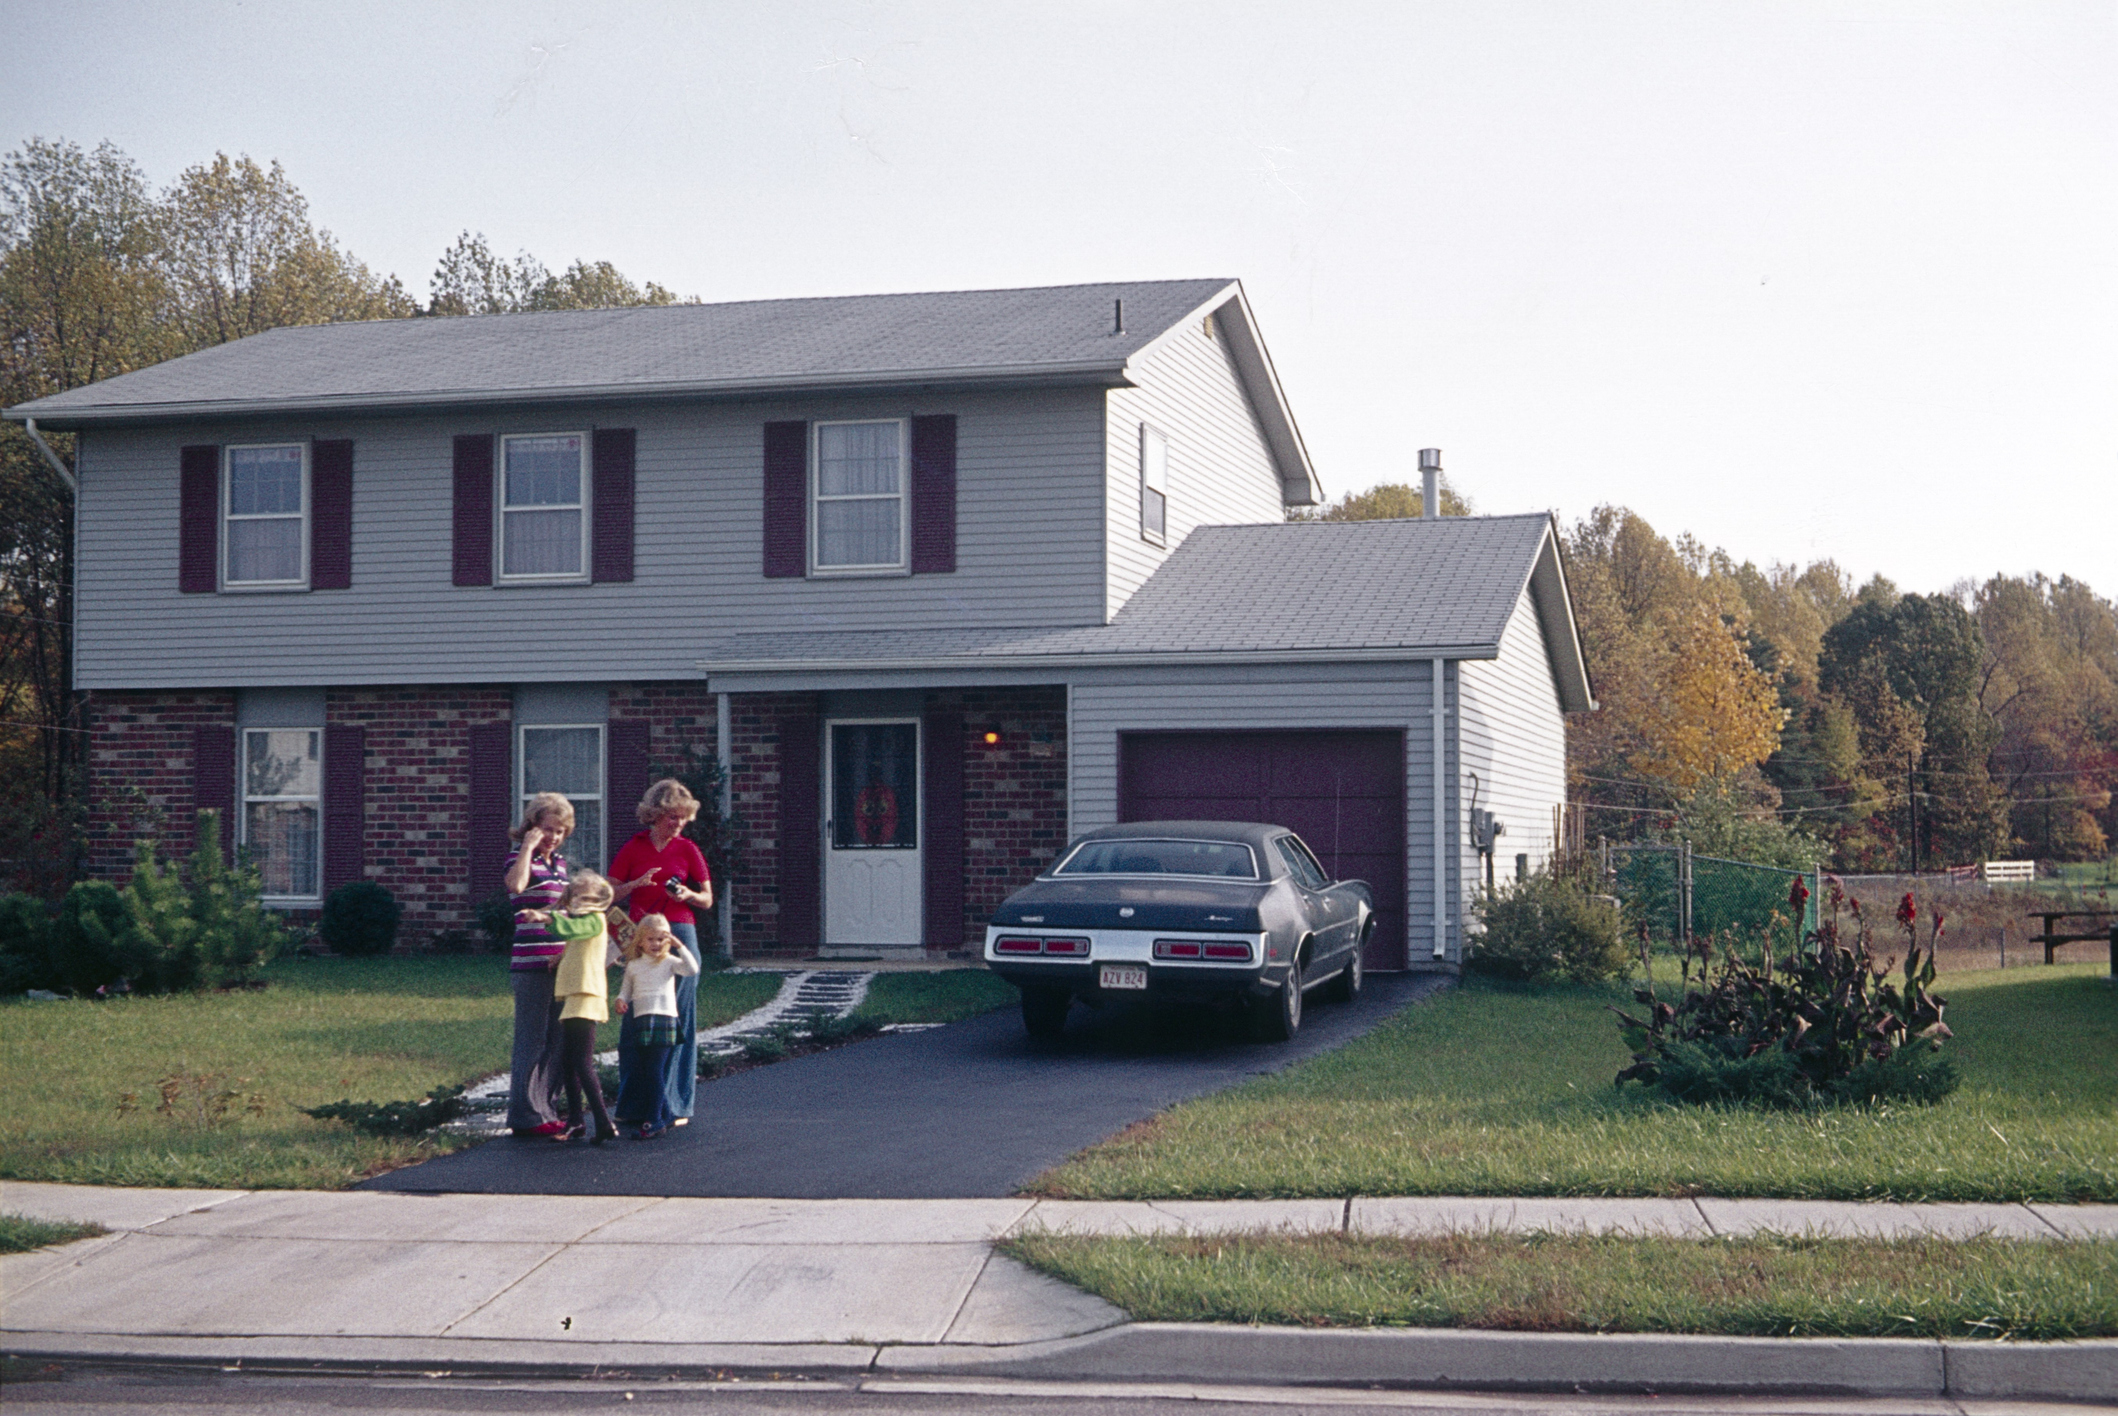
The U.S. Census Bureau reports that the median sales price of a new home in 1976 was about $43,200. By 2025, the latest complete annual benchmark available as of July 2026, the median new-home price was roughly $420,000.
Those are comparable measures because both describe the median price of newly sold homes, rather than mixing new construction with existing-home sales. The Census maintains its historical new-home sales data, which shows how sharply national prices have moved over time.
| Year | Median New-Home Price | Price in 2025 Dollars |
|---|---|---|
| 1976 | $43,200 | About $244,000 |
| 2025 | About $420,000 | About $420,000 |
The 1976 figure converts to roughly $244,000 in 2025 dollars using the Consumer Price Index. In other words, general inflation would have lifted that $43,200 home to about $244,000. The actual national median was about 72% higher.
Local results can look far different. A buyer in Pittsburgh, Cleveland, or St. Louis may see a smaller gap. Buyers in coastal California, South Florida, Boston, and parts of the Mountain West often face prices far above the national median.
What a Typical Home Cost in 1976
A $43,200 new home in 1976 was not necessarily a suburban four-bedroom house with today's finishes. Census data from that period shows that newly completed one-family homes averaged roughly 1,550 square feet.
Smaller lots, simpler kitchens, fewer bathrooms, and lower construction standards helped hold prices down. Yet location still mattered. A home near a major job center cost more than a similar house in a small town, much as it does now.
How Much Home Prices Have Outpaced Inflation
National median new-home prices rose about 872% in nominal dollars between 1976 and 2025. Overall consumer prices rose far less during the same period.
The BLS inflation calculator helps show the difference. Inflation erodes the buying power of money, but it doesn't explain the full rise in housing costs. Land values, limited supply, zoning rules, population growth, construction labor, and higher demand in popular metro areas all affect what buyers pay.
A new home today may also include different features and energy standards. Even so, the gap remains large after allowing for those differences.
Could Workers Afford a Home More Easily in 1976?

Home affordability depends on income and financing, not price alone. In 1976, the median new-home price was about 3.6 times the median U.S. household income of roughly $11,960. Using a 2024 median household income of $83,730 and a 2025 median new-home price near $420,000, the ratio is about 5.0.
That extra 1.4 times income is meaningful. It can add years of saving or force buyers to choose a smaller home, a longer commute, or a different region.
Mortgage rates were also high in 1976. Freddie Mac's historical records put the average 30-year fixed rate near 8.9% that year. Rates in 2025 averaged closer to the mid-6% range. You can review the long-term series through Freddie Mac's mortgage rate archive.
Minimum Wage and Earnings Then and Now
The federal minimum wage was $2.30 an hour in 1976. In 2026, it remains $7.25 an hour, unchanged since 2009.
At $2.30 an hour, a worker would need about 18,800 hours of gross pay to equal the 1976 median new-home price. At $7.25 an hour, matching a $420,000 home price requires nearly 58,000 hours. That equals about nine years of full-time work in 1976 versus almost 28 years today, before taxes or living expenses.
Minimum wage is only one benchmark. Many workers earn more, and several states and cities set higher minimums. Still, the comparison shows why one low-wage income rarely supports homeownership in most markets.
Median household income offers a broader view. The Census income report tracks how household earnings have changed, although a modern household may include two earners while a 1976 household may have had different work patterns.
The Salary Needed to Buy a First Home
A simple payment test puts the pressure in plain view. Assume a 30-year fixed mortgage, a 20% down payment, a payment cap of 28% of gross monthly income, property taxes equal to 1.2% of home value, and homeowners insurance at 0.4% in 1976 and 0.35% today.
| Benchmark | 1976 | 2025-2026 Era |
|---|---|---|
| Home price used | $43,200 | $420,000 |
| 20% down payment | $8,640 | $84,000 |
| Estimated monthly principal and interest | About $275 | About $2,170 |
| Estimated monthly payment with tax and insurance | About $333 | About $2,713 |
| Gross salary needed at 28% | About $14,300 | About $116,300 |
The 1976 salary target slightly exceeded median household income. The current target is roughly 39% higher than the latest national median household income figure.
Because the 28% test reserves 72% of gross income for other costs, both examples appear manageable on paper. However, that remaining amount must also cover federal and state taxes, food, transportation, health care, debt, child care, repairs, and retirement savings.
A lender may approve a payment that still leaves a household with little room to save or handle an emergency.
Student loans, credit-card balances, closing costs, and private mortgage insurance can push the real income target higher. A 5% or 10% down payment lowers the cash needed upfront, but it also raises the loan balance and monthly payment.
How the Cost of Living Changes the Comparison
Lower home prices in 1976 did not mean every household expense was low in the same proportion. Gasoline shocks affected transportation budgets in the 1970s, and mortgage rates were painful.
Still, several modern costs compete heavily with down-payment savings. The Consumer Price Index shows that medical care has risen faster than the overall CPI over the long run. College costs, child care, insurance premiums, and rent can also take a larger share of a young household's budget.
Food, utilities, transportation, and health expenses vary by city. A household earning enough to qualify for a mortgage may still struggle to build an $84,000 down payment while paying market rent.
First-Time Home Buyers Are Older in 2026
Historical housing profiles place the typical first-time buyer in the 1976 era at about 29 years old. The National Association of Realtors' latest Profile of Home Buyers and Sellers puts the median age of first-time buyers at 40, based on its 2025 report.
That is an 11-year shift in the age when many people make their first purchase. The NAR buyer and seller profile also shows that first-time buyers make up a smaller share of buyers than they did in earlier decades.
Delayed marriage and parenthood explain part of the change. Higher student debt, slower savings growth, high rent, and expensive starter homes explain another part. Lending rules are also more documented and debt-sensitive than they were before the financial crisis.
Why Saving for a Down Payment Takes Longer
A 20% down payment on the 1976 median new home was $8,640, or about 72% of median household income. On a $420,000 home, the down payment is $84,000, almost equal to a full year of current median household income.
Family gifts and first-time buyer programs can shorten that timeline. FHA loans and some conventional loans also allow smaller down payments. However, buyers who put less down often pay mortgage insurance and carry a larger monthly obligation.
Emergency savings matter too. A household that empties its accounts to close on a home may have no cushion for a roof repair, job loss, or medical bill.
Why More Homeowners Are Renovating Instead of Moving
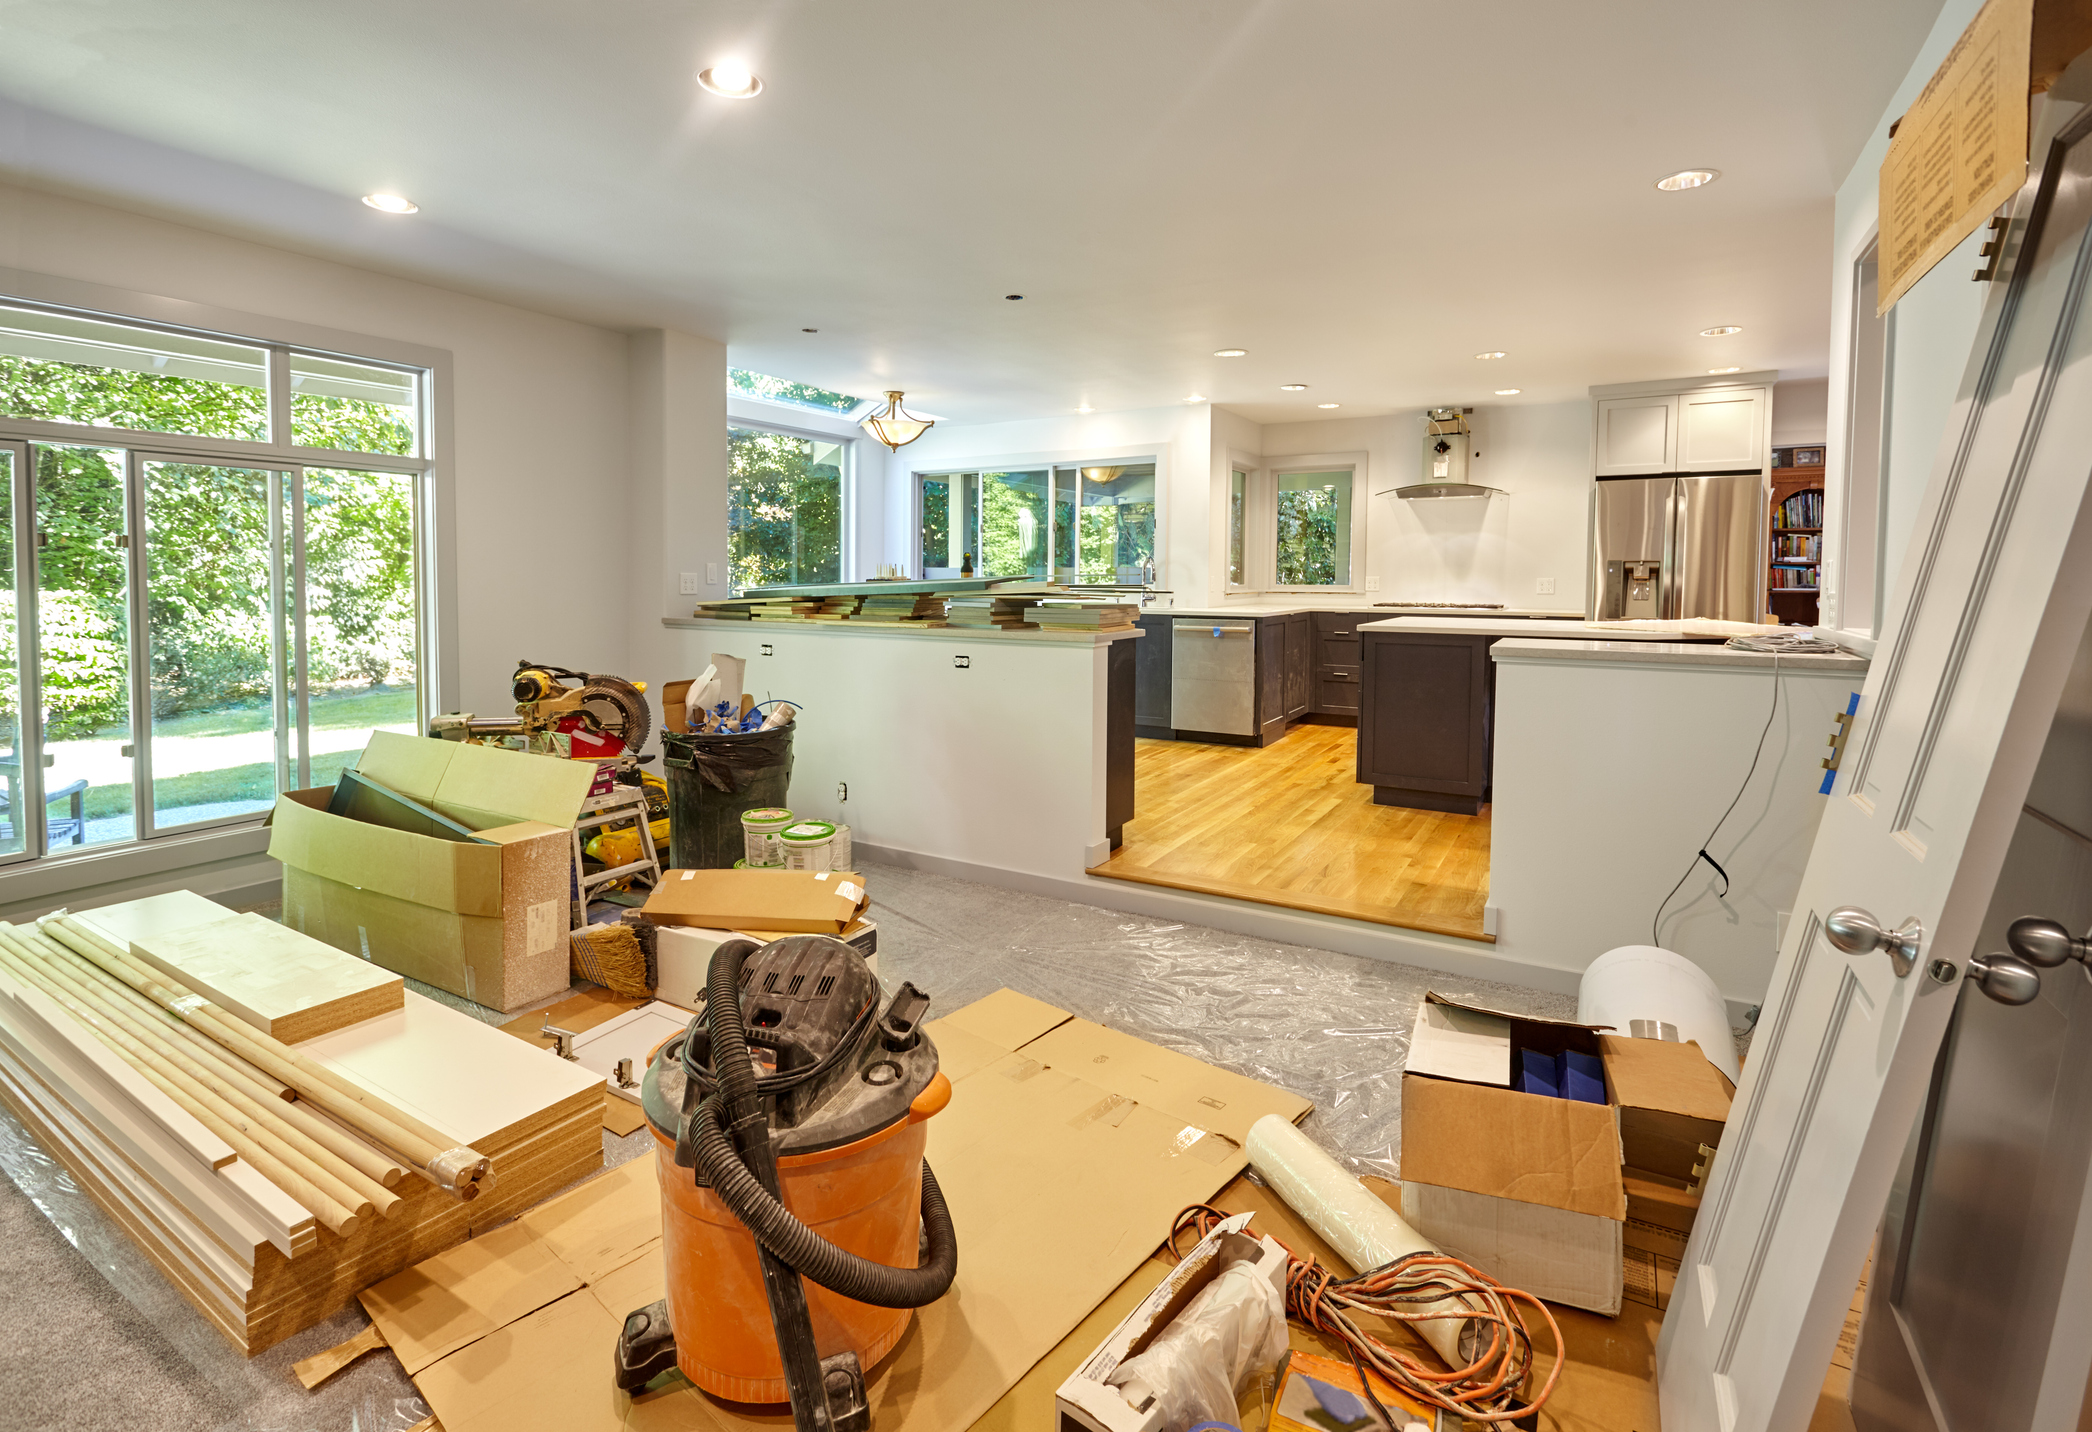
Many existing owners hold mortgage rates far below today's rates. Selling a home with a 3% loan and buying another with a rate near 6% or 7% can raise the payment even when the new home isn't dramatically more expensive.
That lock-in effect, limited inventory, agent fees, moving costs, and higher home prices make renovation appealing. The Harvard Joint Center for Housing Studies has tracked historically high homeowner spending on improvements and repairs.
Kitchen updates, bathroom renovations, finished basements, home offices, additions, energy upgrades, and accessory dwelling units can help a home fit a changing household. Renovation does not always cost less than moving, though. Permits, contractor pricing, financing, construction delays, and added property taxes can change the calculation.
When Renovating May Make More Sense Than Buying
Renovation may fit owners who need one more bedroom, an accessible bathroom, a dedicated workspace, or better insulation and windows. It can also work well when the neighborhood, commute, school options, and existing mortgage already suit the household.
Moving may be better when a home has major structural problems, the location no longer works, or renovation costs approach the gap between the current home and a suitable replacement. Owners should compare complete costs, not only the contractor estimate or listing price.
How to Make a Fair 1976 and 2026 Home Affordability Comparison
National averages offer context, but your city determines the real decision. Compare similar home types, use local property taxes and insurance, and separate the purchase price from the monthly payment.
Use this framework when checking a local market:
| Year | Home Price | Inflation-Adjusted Price | Minimum Wage | Typical Income | Mortgage Rate | Down Payment | Estimated Payment | Buyer Age |
|---|---|---|---|---|---|---|---|---|
| 1976 | $43,200 | About $244,000 | $2.30 | $11,960 household | 8.9% | $8,640 | About $333 | About 29 |
| 2025-2026 era | About $420,000 | About $420,000 | $7.25 federal | $83,730 household | Mid-6% range | $84,000 | About $2,713 | 40 |
Update current-year prices and rates before relying on any estimate. A lower-priced market with high taxes can cost more monthly than a pricier market with lower taxes and insurance.
The Larger Affordability Gap
A typical buyer faces a larger home-price-to-income burden in 2026 than in 1976, even after adjusting the older price for inflation. High mortgage rates and an average $84,000 conventional down payment make that burden harder to manage.
That pressure helps explain both later first-time buying and the rise in renovation plans among existing owners. Before buying, waiting, or remodeling, compare the full monthly cost, cash needed at closing, and how long the home can meet your needs. And if you decide remodeling is the way to go, find vetted contractors backed by the TrustDALE $10,000 Make It Right Guarantee at Trustdale.com.